As a test engineer, observability tools are a crucial part of my workflow. They help me triage errors, understand user behavior, and map out service dependencies. This weekend, I decided to dive into Sentry.io — a platform I’ve heard is widely used in leading tech companies. Curious to see its capabilities firsthand, I integrated it into one of my pet projects.
Setup
Setting up Sentry for my React frontend and Express backend was surprisingly simple. After registering, Sentry provided clear and intuitive setup instructions, making the process seamless. In just 30-45 minutes, I had everything up and running for my production build (running locally). That’s how straightforward it is.
Issues Insides
Once Sentry is set up, it provides a quick start guide to help you get started with monitoring your application effortlessly. You can intentionally throw errors to see how Sentry catches them and provides valuable insights, such as when the error first occurred, how many times it was triggered, and how many users were affected. Another great feature is the ability to set priorities for errors and assign them to specific team members for investigation and resolution.
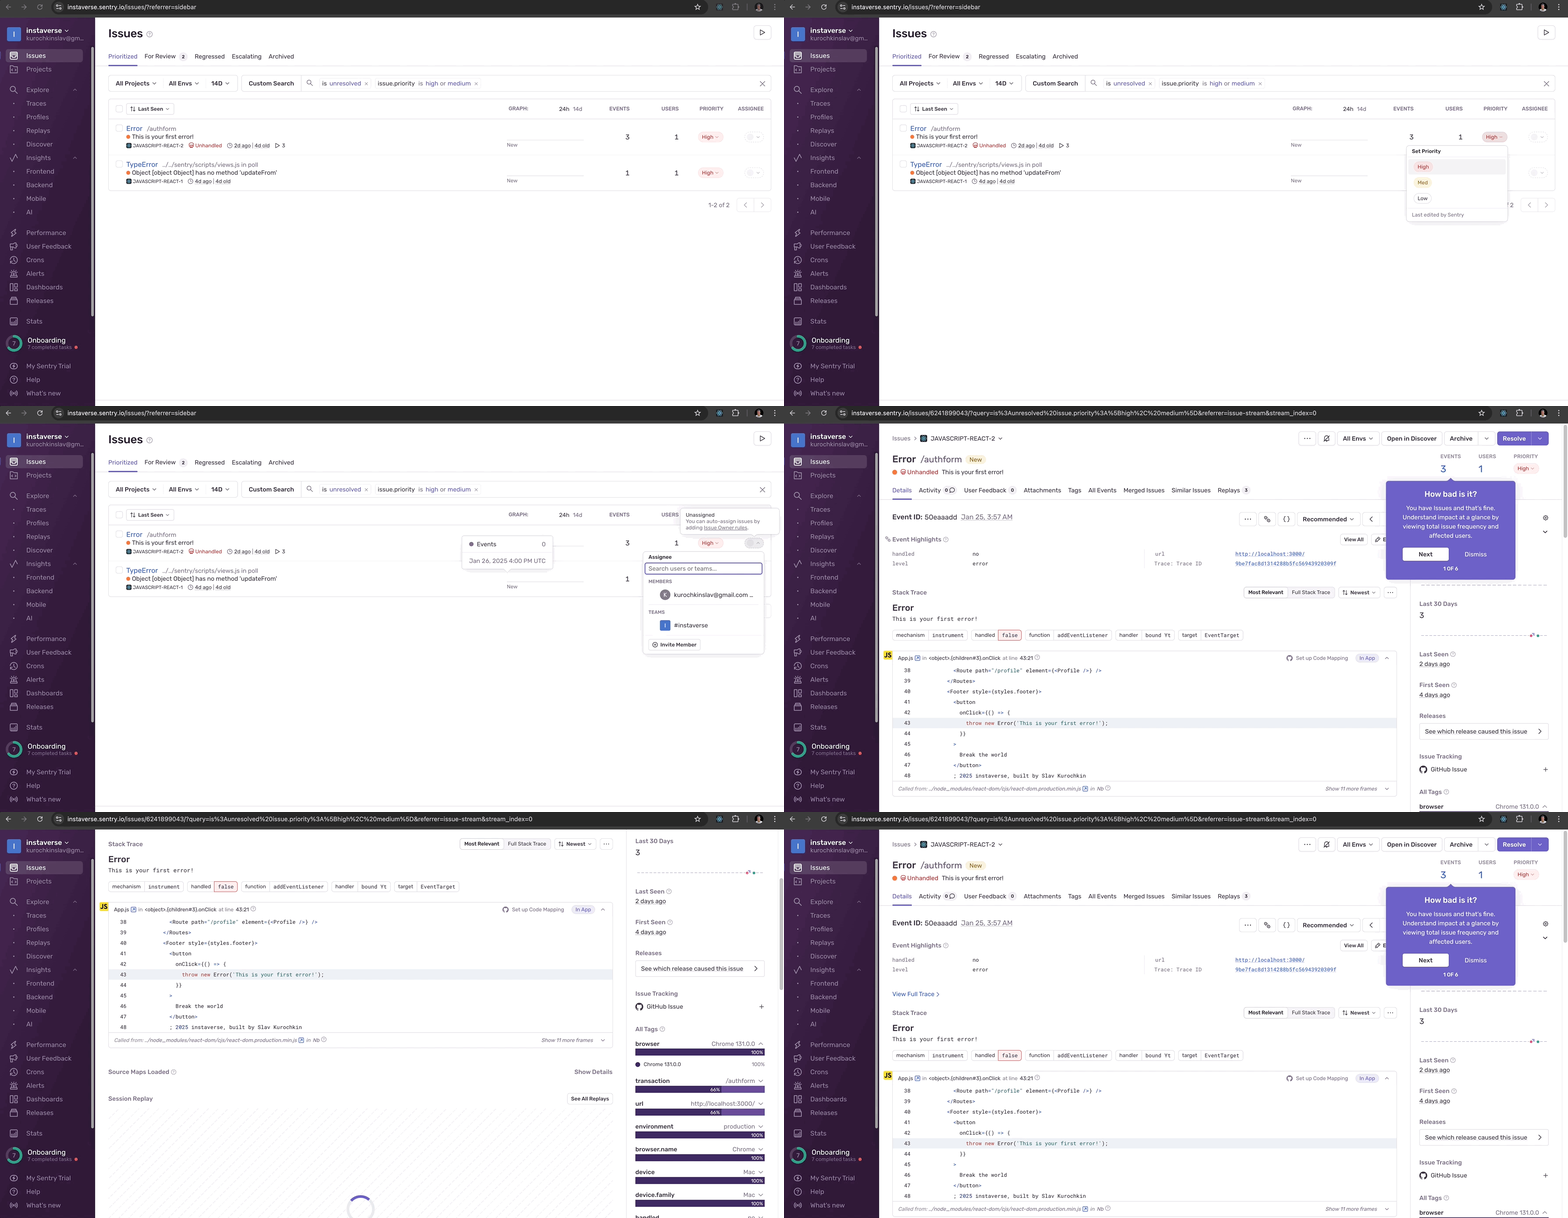
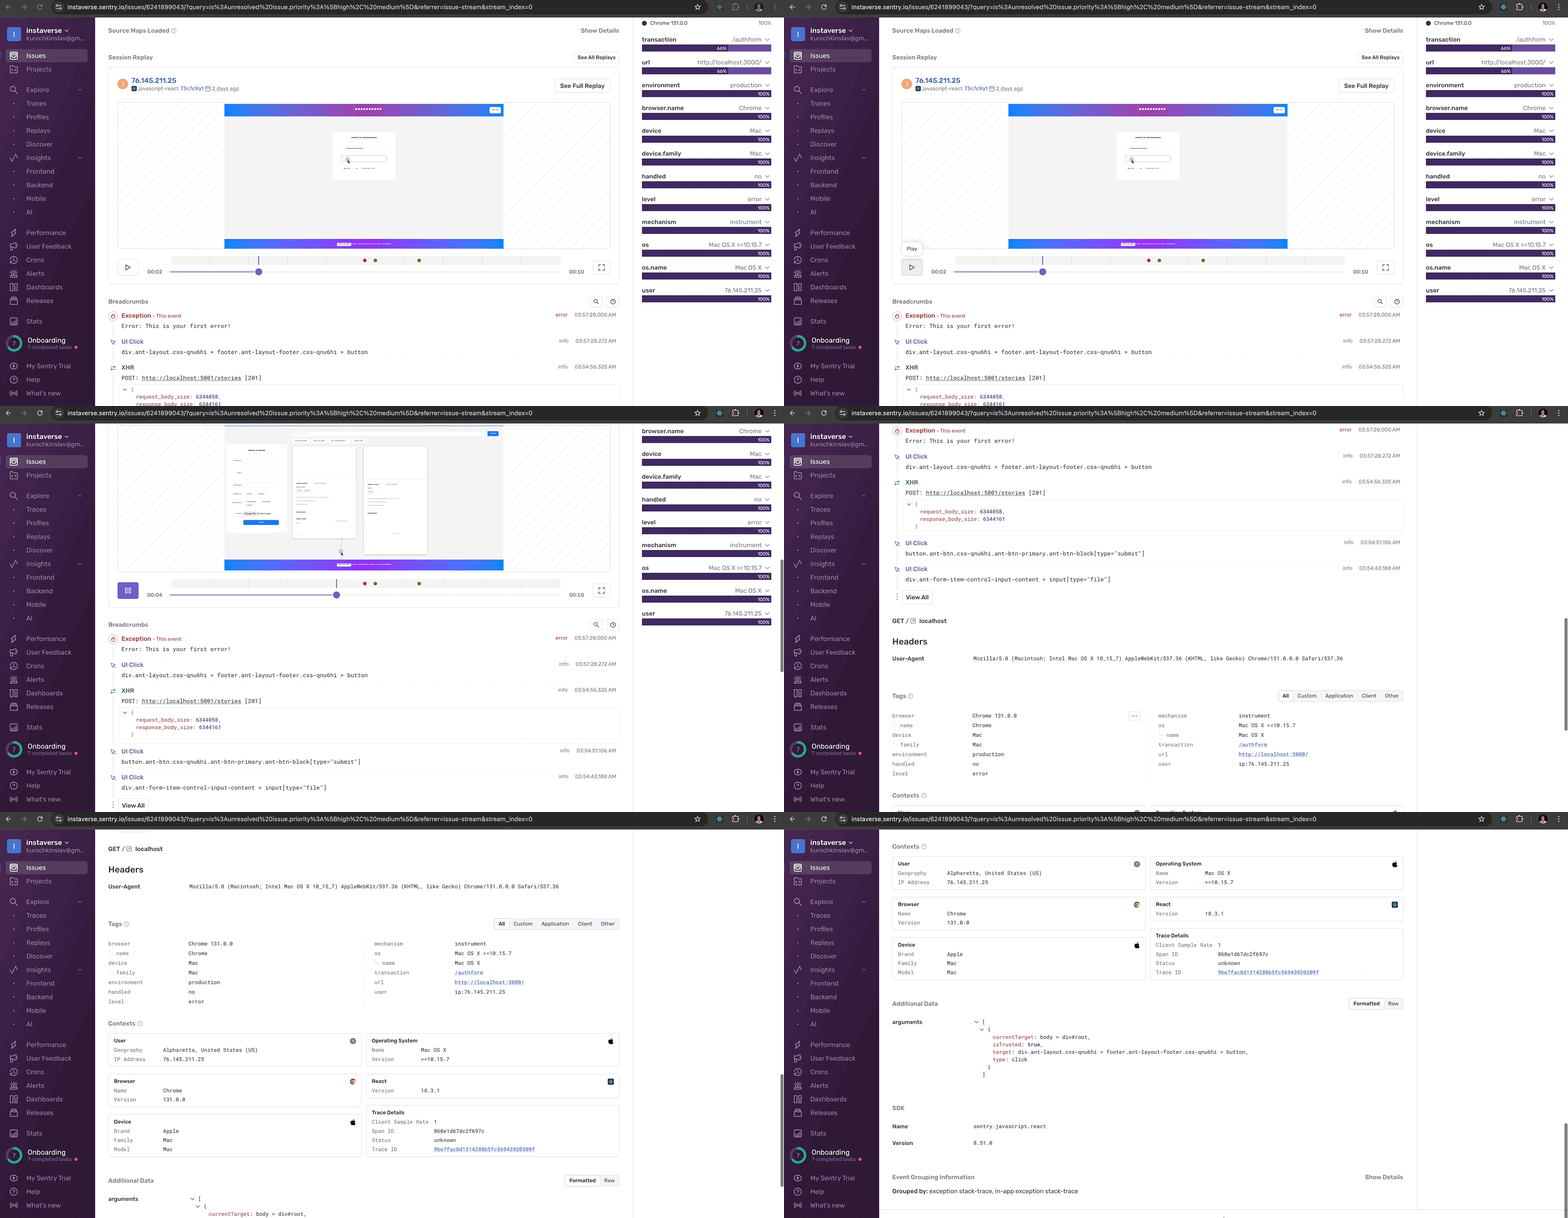
Sentry also allows you to replay issues, providing a visual representation of what occurred. It’s designed with privacy and security in mind, ensuring that no sensitive information is captured during the playback. This makes it an excellent choice for companies that prioritize user privacy and data security. Additionally, Sentry pinpoints the exact location where the error occurred, traces it to the service level, and provides details about the user’s system, including their browser, operating system, and more.
Navigation
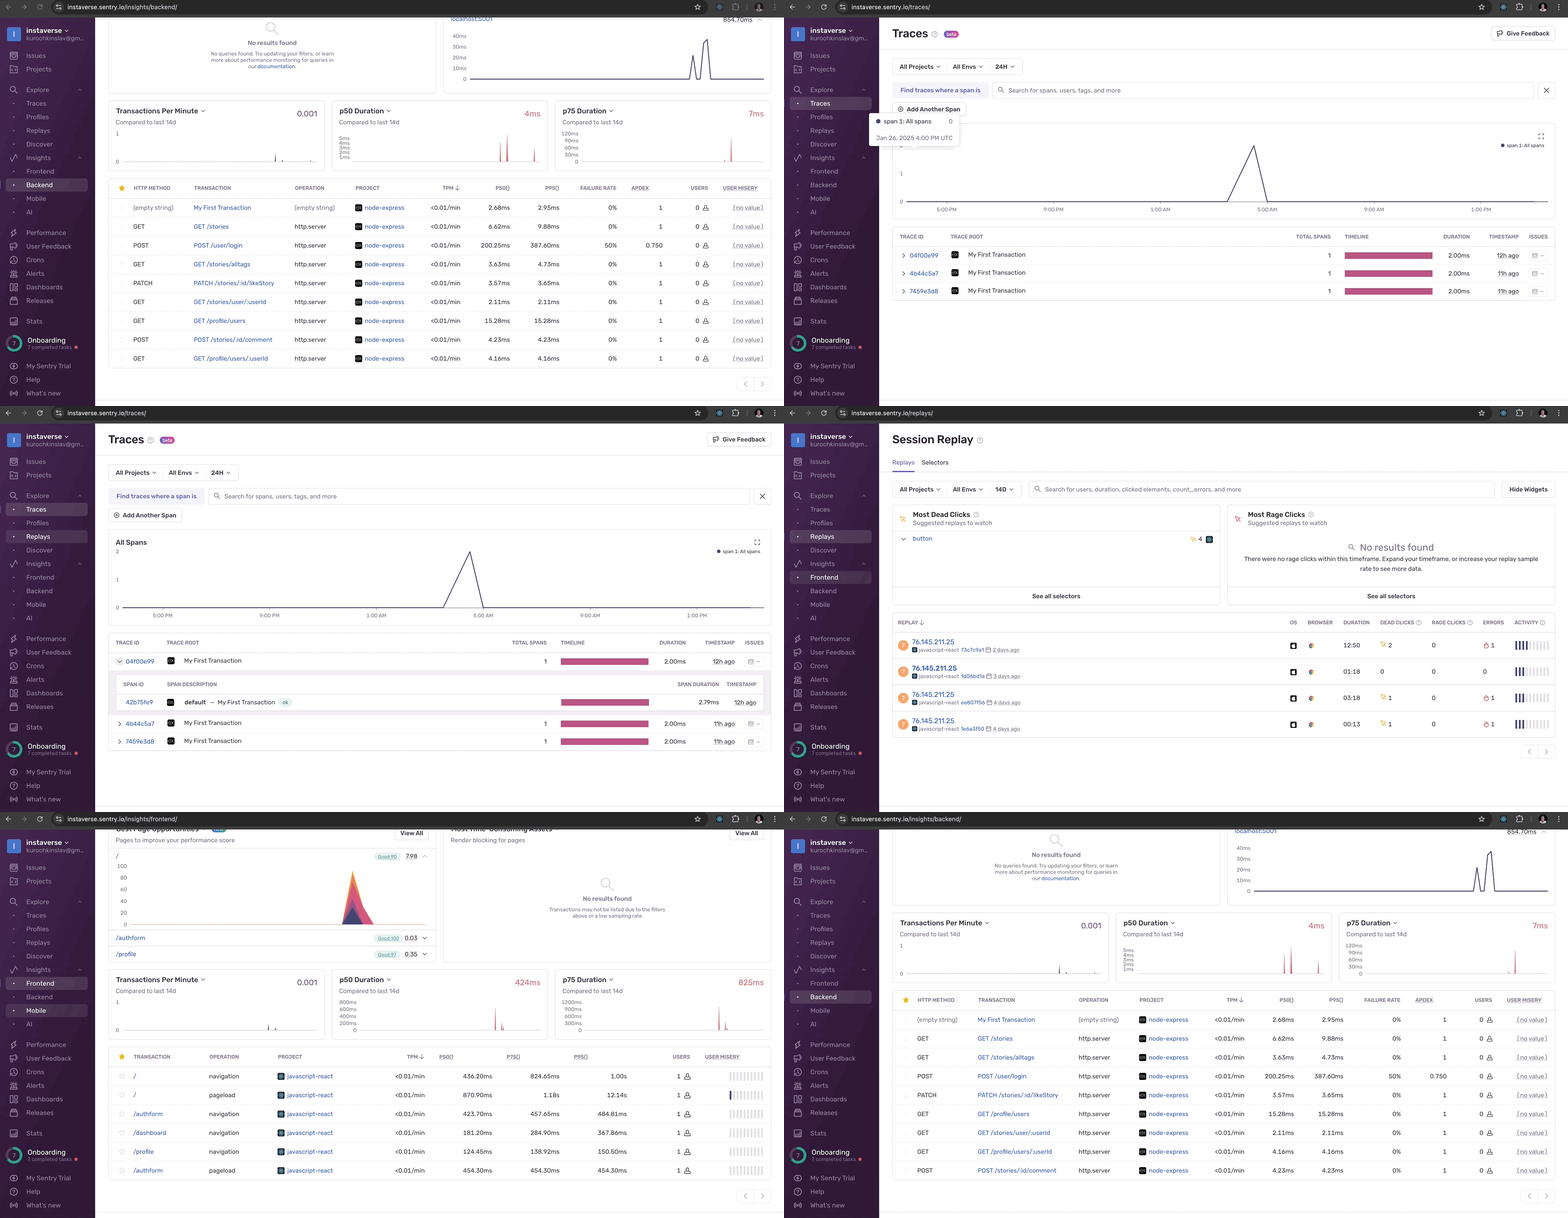
Sentry makes it is to navigate the application, you want dive into specifics, just go through the menu options, or go to the insides for the services: frontend, backend, mobile or all.
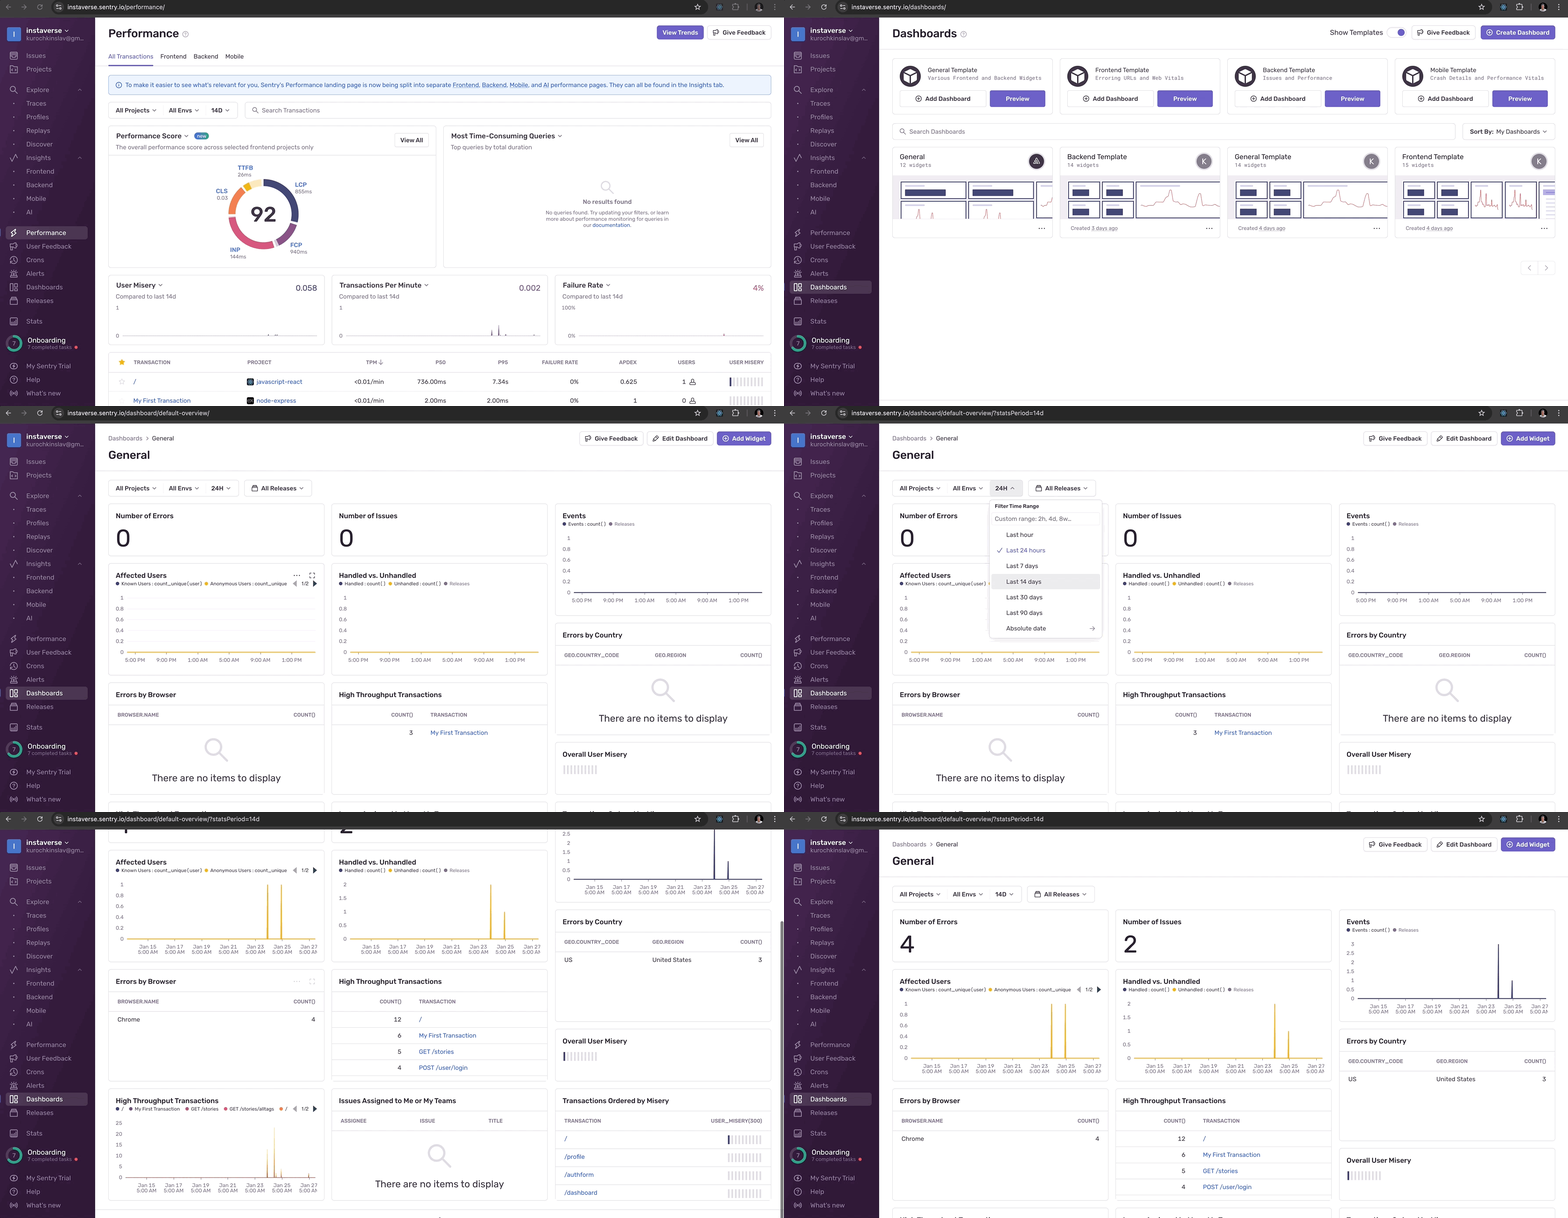
Performance monitoring
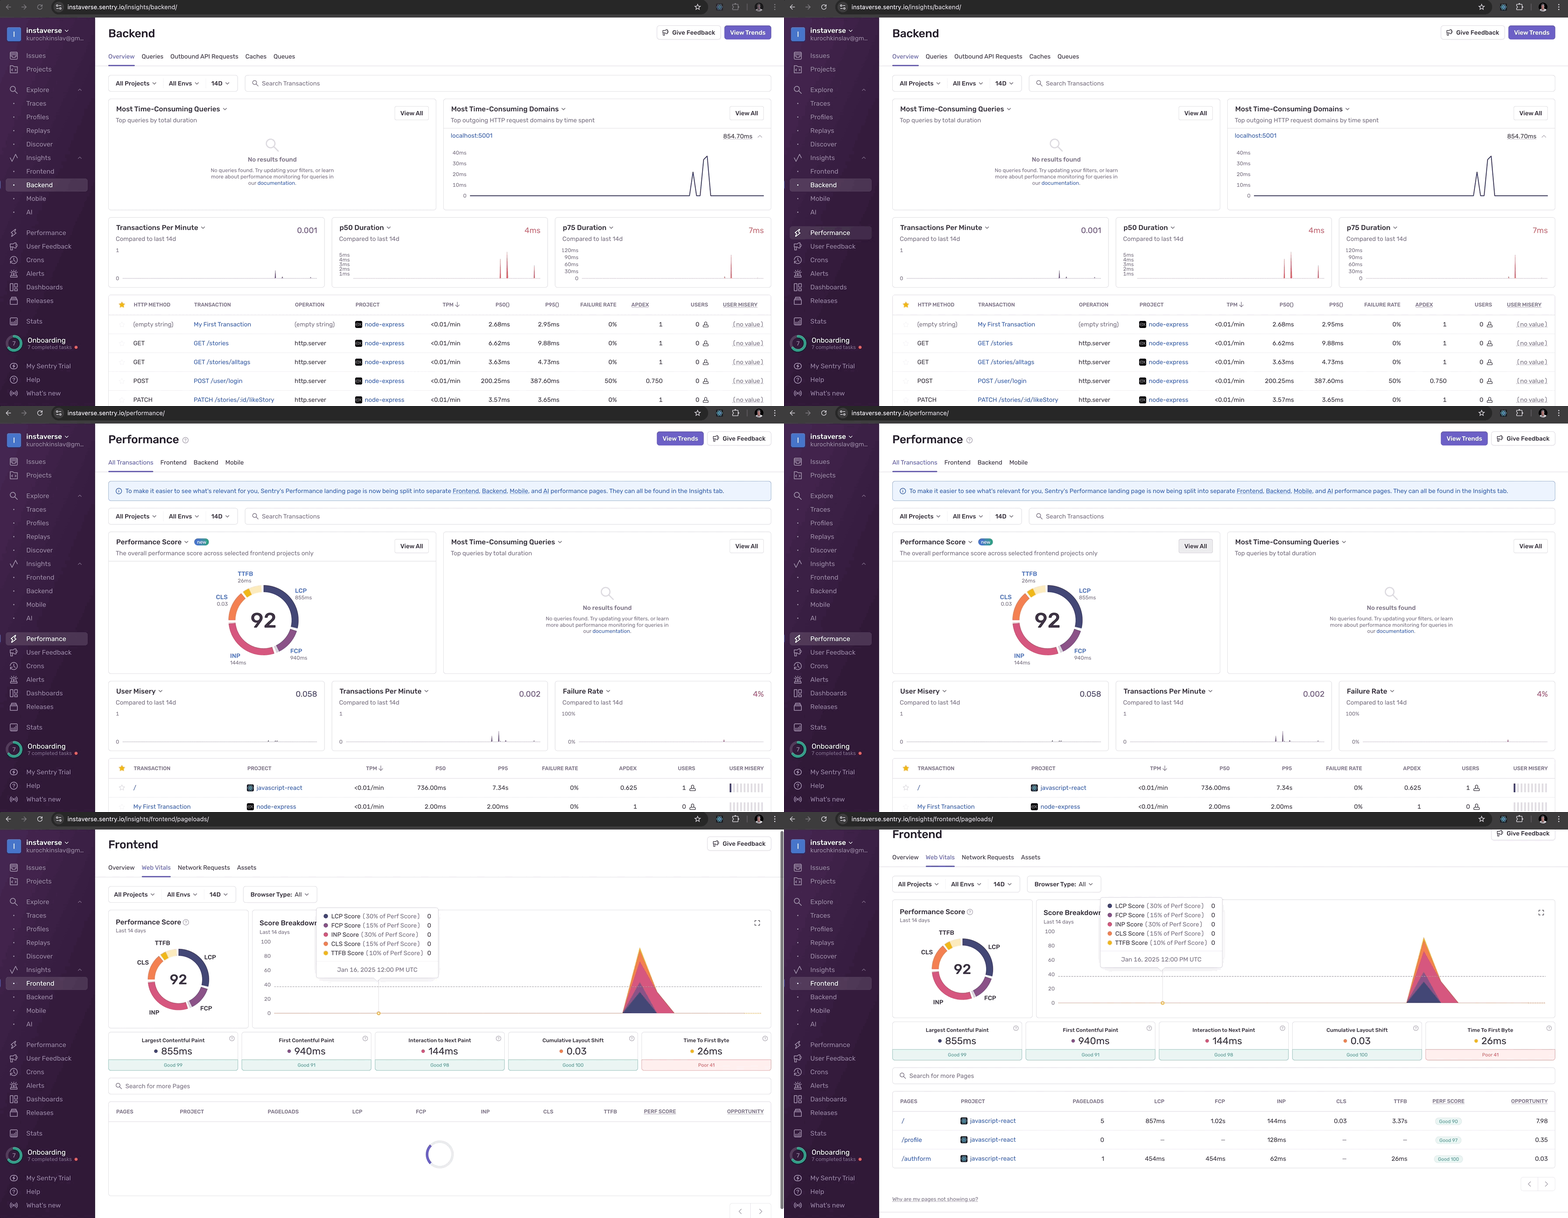
Another great feature is application performance observability. I’m a bit skeptical about field data, not in Sentry, but in general, but it is a great companion for you lab performance data which can lead to a lot of insides. If you want learn more on the difference between field and lab data performance, I highly encourage you to watch Web Performance Fundamentals by Todd Gardner.
Dashboards
Dashboards is another great feature, you can either customize it or use default templates provided by Sentry.
Other features
These are just the features I explored in my local setup. Sentry offers even more capabilities and integrations that provide valuable insights, such as integrating with your source code and CI/CD pipelines, setting up alerts, and much more.
Final words
To summarize Sentry is an invaluable tool for any team looking to enhance their error monitoring and troubleshooting processes. With its intuitive setup, detailed error tracking, and powerful integrations, it helps developers and engineers quickly identify and resolve issues, improving application reliability and user experience. Its focus on privacy and security makes it a trusted choice for companies of all sizes, while its ability to provide actionable insights at every level—from the code to the user’s system—ensures that no issue goes unnoticed. Whether you’re working on a small project or scaling for enterprise-level operations, Sentry is a tool worth considering to streamline your monitoring and debugging workflow.


