
Those who worked with mobile applications UI testing in Appium used to elements finder which comes with Appium Inspector, but when you work with Detox finding elements is quite challenging.
In this post we going to see how you can debug React Native UI using XCode. Since we going to use XCode you will need to run your app build on Mac. Let’s get started.
Build your React Native app and launch it in iOS Simulator. Now we can debug the app, here is how to do it:
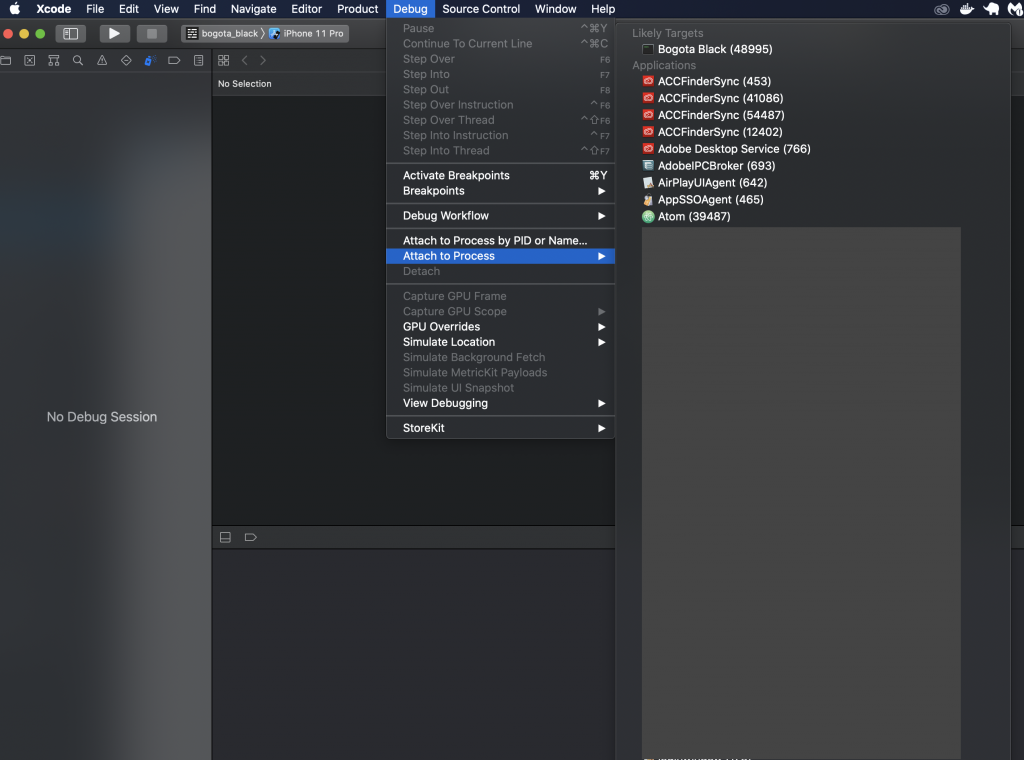
- Open XCode and go to Debug menu
- In Debug menu select Attach to Process (make sure your app running in Emulator)
- Find your app and attach to that process
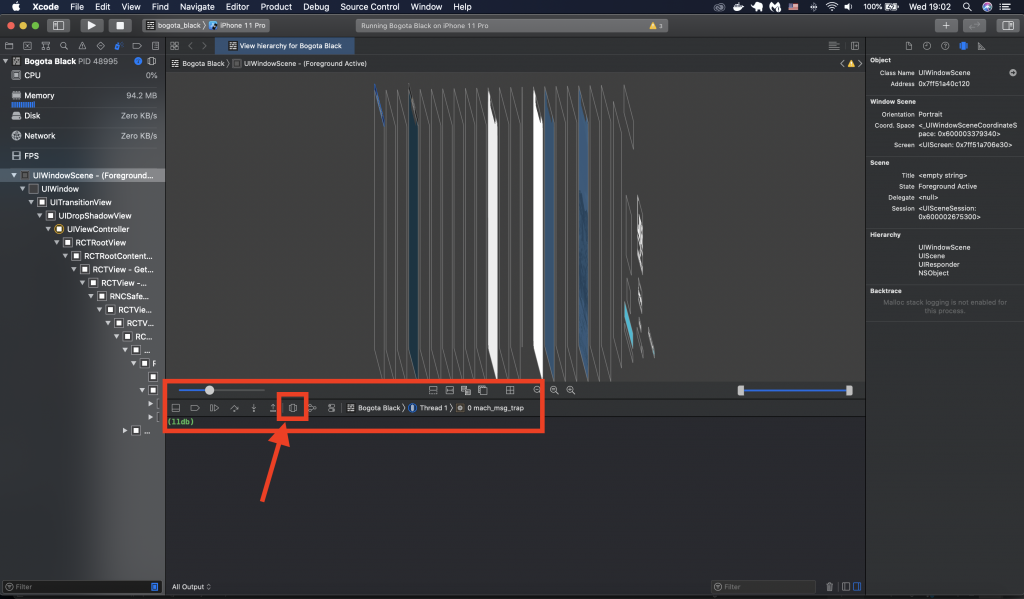
4. Once you attached to your app you will see different debug options. The one we looking for is Debug View Hierarchy (see screenshot below)
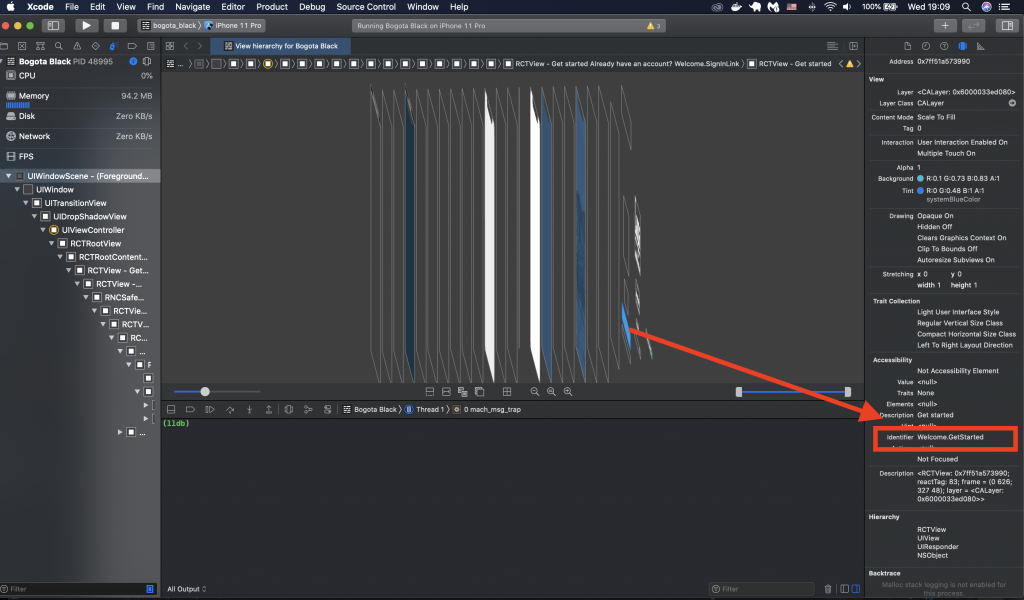
5. Great. Now we can see our elements on the screen and inspect them. Basically select the element you looking for and see if it have your testID.
There would be a time when you add testID to react native app and Detox would complain that element is not visible or not hittable (if you trying to tap based of element coordinate).
 Error: Test Failed: View “<RCTTextView: 0x7f82ba58c470>” is not visible: view is clipped by one or more of its superviews' bounds and does not pass visibility threshold (75%)
TIP: To print view hierarchy on failed actions/matches, use log-level verbose or higher.
Test Failed: View "_element_" is not hittable at point _coordinates_
Here is few issues reported in detox GitHub repository:
So what can you do to debug the problem?
We will need to modify detox configuration file, if you not familiar with detox configs and different options here is a good doc to read about it.
For debugging purposes we would want to add artifacts to our config file (in my case .detoxrc.js) which includes: log, uiHierarchy, screenshots and video. Here is how artifacts object look like
artifacts: {
    rootDir: 'e2e/.artifacts/',
    plugins: {
      instruments: { enabled: false },
      log: { enabled: true },
      uiHierarchy: 'enabled',
      screenshot: {
        shouldTakeAutomaticSnapshots: true,
        keepOnlyFailedTestsArtifacts: true,
        takeWhen: {
          testStart: false,
          testDone: true,
        },
      },
      video: {
        android: {
          bitRate: 4000000,
        },
        simulator: {
          codec: 'hevc',
        },
      },
    },
  },
In order for video to start recording failing tests we actually need to do one more thing, in your test execution script (in package.json) you would need to add –records-video failing (we going to record only failed tests) flag:
detox test --record-videos failing --configuration ios.sim.debug --cleanup
Now we can run the tests and let it fail. After test fail look at the artifacts path (the one we defined as rootDir in artifacts object), you will see successful and failed tests. The one we are interesting in is failed, here is what we going to see in the test report:
- Log for the test
- Screenshot at the moment of failure
- Video recording of the whole tests
- .viewhierarchy files
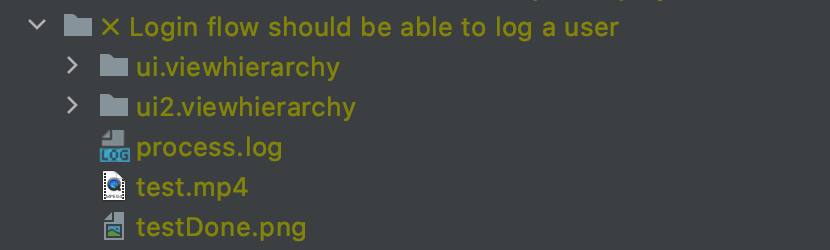
In my case you can see two .viewhierarchy files (although in WebStorm IDE it shows like a folder, it’s in fact file that can be viewed in XCode), the reason for that is that I’m re-running failed tests so it generates two files. Most of the time you would be interested in the top one cause that’s where your test failed before attempting to re-run.
So similar to how we seen hierarchy of the app while running it in debug, now you can open .viewhierarchy file in XCode and see UI hierarchy at the moment when the test failing.
And that is how you debug detox tests and UI of React Native apps, there is also an option to run React Native debugger, but that is only going to work if you running the app in debug mode, which is not always the case.
P.S. It looks like latest Detox update (17.x.x which per my understanding was mainly done to support XCode 12 update), have issues locating elements on the screen and I had to do a hack to click “hidden” elements, which I will explain in another post.
Hope this post was useful and as always feel free to post your questions/suggestions in the comments section below.


